The changing dynamics of the crypto market have opened up Harmony (ONE), Render (RNDR), Near Protocol (NEAR), dogwifhat (WIF), and Stellar Lumens (XLM) to potential profits.
BeInCrypto has analyzed the direction these cryptocurrencies could take and how it would affect the entire crypto market.
Harmony (ONE) Hits a New Milestone
ONE has successfully surpassed $1 million in transaction volume. This shows that the chain is noting a surge in usage and demand, which could also boost its price action.
When writing, the altcoin can be seen moving in a descending wedge, and a breakout from the same can occur in the next month. Thus, based on this pattern, ONE could rally by over 36% to hit the target of $0.034 to mark a two-month high.
The chances of this happening are very high, looking at the Average Directional Index (ADX). This indicator analyses the strength of the active trend, and since it is above the threshold of 25.0, the present trend is getting stronger.
Read More: Harmony (ONE) Price Prediction for 2024
However, if the altcoin breaks down below this wedge, it could lose the bullish potential and fall below $0.015, marking a three-month low for Harmony’s price.
Dogwifhat (WIF) Heads the Meme Coin Market Storm
While Solana meme coins were already competing with PEPE over dominance, WIF came in and ended the discussion at once. The meme coin surpassed PEPE to become the world’s third-biggest meme coin; by the looks of it, this growth will continue in the coming month.
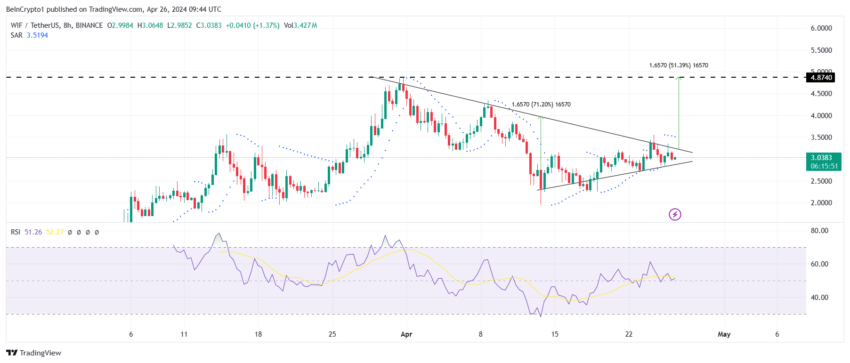
At the time of writing, the meme coin can be seen moving within an isosceles triangle pattern. Per this pattern, a breakout in WIF price is expected, which could potentially send the meme coin to $4.8. This would mark a 51% increase for dogwifhat bolstering its dominance.

Read More: Dogwifhat (WIF) Price Prediction 2024/2025/2030
Nevertheless, losing support for the bottom trend line is also possible if WIF holders opt to sell. As a result, the meme coin could lose the support of $2.5 to test $2.0 as the next support floor. That would effectively invalidate the bullish outcome.
Near Protocol (NEAR) Is Near the 2024 High
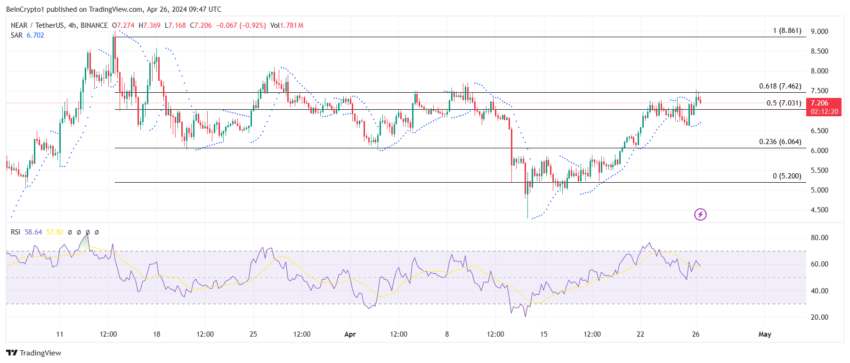
NEAR price will mostly leverage the effect of the Bitcoin halving event, which is anticipated to push the altcoin prices upwards. The altcoin recently bounced off the support of $5.2 to trade at $7.2 at the time of writing.
The altcoin is inches from the 61.8% Fibonacci Retracement of $8.8 to $5.2. Marked at $7.4, this level is known as the bull market support floor. Reclaiming it would allow NEAR price to bounce and breach the $8.8 barrier, effectively posting a new 2024 high.

Read More: What Is NEAR Protocol (NEAR)?
But if the altcoin falls to $6.0 or below, the 23.6% Fib line would also be lost. This could leave the altcoin vulnerable to a further correction, invalidating the bullish outlook.
Render (RNDR) Banks on AI
Optimism surrounding Artificial Intelligence (AI) is resurging in Q2, with expectations of bullishness propelling AI tokens upward. Among these tokens is Rander, which has been in a downtrend for the past month.
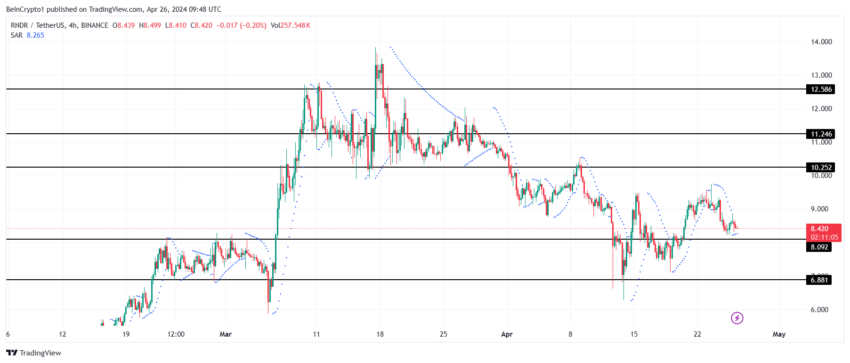
An increase in interest in AI will render RNDR’s price a potential recovery asset. Bouncing off the support of $8.0 to potentially breach and flip $10.0 resistance to rally towards the all-time high is the anticipated outcome for RNDR price.

Read More: Render Token (RNDR) Price Prediction 2024/2025/2030
Nevertheless, losing the $8.0 support will increase the RNDR price to $6.8. Falling through it could wipe out the bullish outcome’s potential.
Stellar (XLM) is a Good Bet
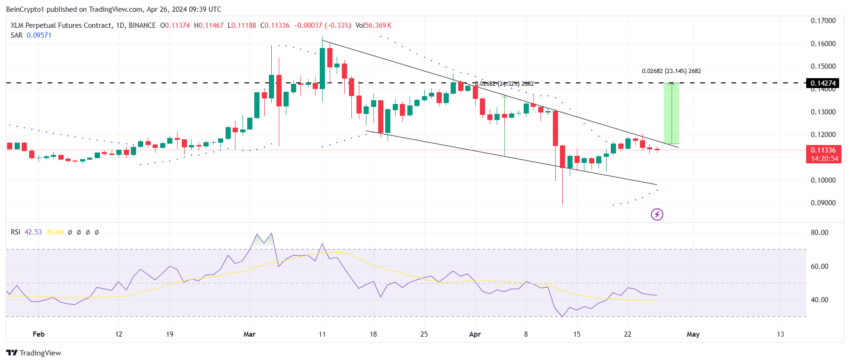
While Stellar is not observing any major development, it is certainly among some of the underestimated assets in the crypto market. XLM price is presently trading in a descending wedge.
Per this pattern, a breakout could send XLM to $0.142, which would mark a 23% gain for the altcoin. This would enable XLM to chart a new all-time high by crossing $0.160.

Read More: Stellar (XLM) Price Prediction 2024/2025/2030
Although the RSI is under the neutral mark, which exhibits chances of the uptrend losing its strength, there is a chance that the decline might continue; if this happens to be the outcome for XLM, the crypto asset could lose the support of $0.10. This would eliminate the bullish outcome and send the altcoin lower below $0.09.
Disclaimer
In line with the Trust Project guidelines, this price analysis article is for informational purposes only and should not be considered financial or investment advice. BeInCrypto is committed to accurate, unbiased reporting, but market conditions are subject to change without notice. Always conduct your own research and consult with a professional before making any financial decisions. Please note that our Terms and Conditions, Privacy Policy, and Disclaimers have been updated.


Be the first to comment