
 Price Hold Above Critical Support?")

Despite a breakout over three months ago, the Ripple XRP price had been consolidating above a horizontal support area.
The XRP price fell below this support area today but is now in the process of reclaiming it again. Will it be successful?
Ripple Falls Below Horizontal Support
Examining XRP’s weekly technical analysis reveals that since May 2022, the altcoin has increased alongside an ascending support line. During this period, XRP broke through a crucial horizontal zone and achieved a new 2023 high in July.
However, the rapid ascent proved unsustainable, leading to a subsequent decline that established a higher low in August (green icon). This resulted in forming a steeper ascending support trend line that is still intact.

While XRP fell today, it validated this support trend line again.
When evaluating market conditions, traders use the RSI as a momentum indicator to determine whether a market is overbought or oversold and whether to accumulate or sell an asset.
If the RSI reading is above 50 and the trend is upward, bulls still have an advantage, but if the reading is below 50, the opposite is true. The RSI is right at 50, a sign of a neutral trend.
Read more: How to Buy XRP and Everything You Need to Know
What Do Analysts Say?
Cryptocurrency traders and analysts on X positively view the future XRP price trend.
RealXRPWhale noted a breakout from a descending resistance trend line, stating that XRP will pump hard.
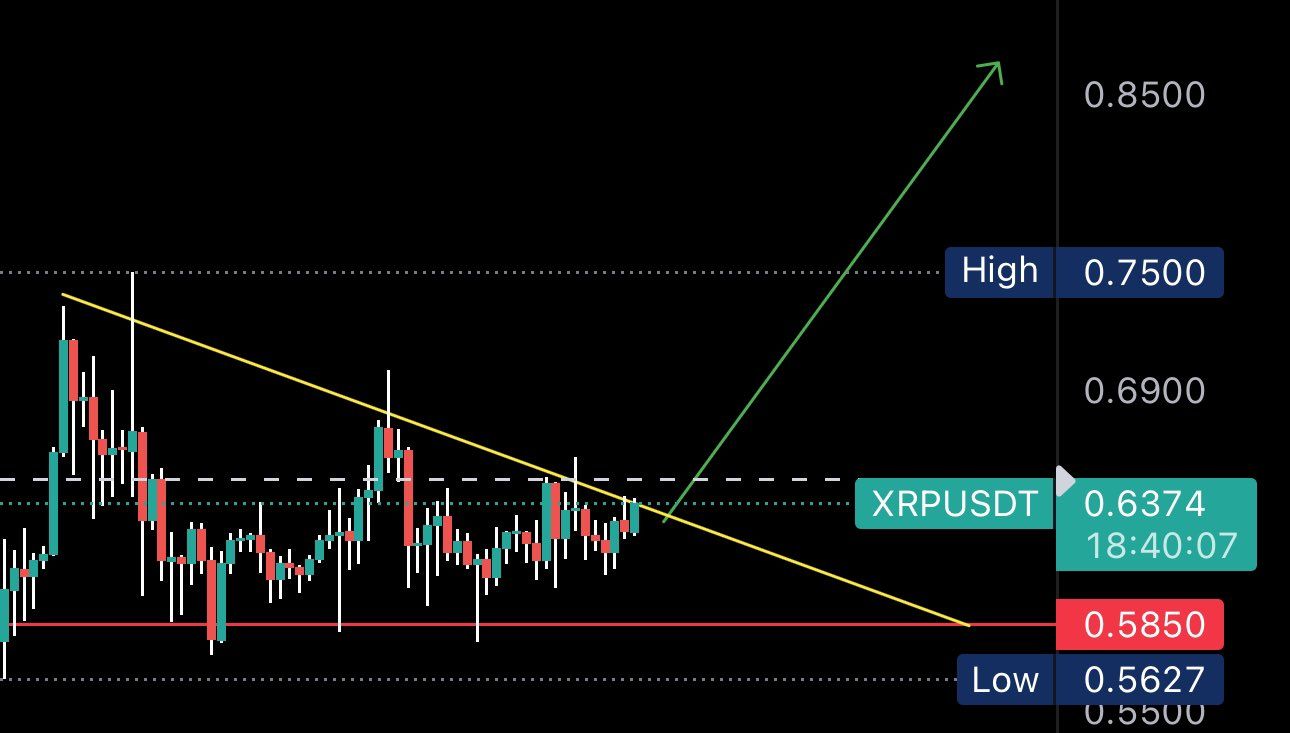
FLASH noted a symmetrical triangle pattern, stating that the breakout from it can accelerate the rate of increase toward $0.85.
Finally, Cryptoes is bullish because the price closed above horizontal support.
Read More: Getting Started With XRP Wallets
XRP Price Prediction: What to Make of Today’s Drop?
Similarly to the weekly time frame, the daily time frame technical analysis gives a neutral outlook. This is because of the price action and RSI readings.
The price action shows that XRP broke out from a horizontal resistance area at $0.54, creating a symmetrical triangle. However, today’s price broke down from the triangle, validating the support area again (green icon).
The RSI is below 50, a sign of a bearish trend. Therefore, the future trend can determine whether the XRP price bounces or breaks down from the area.
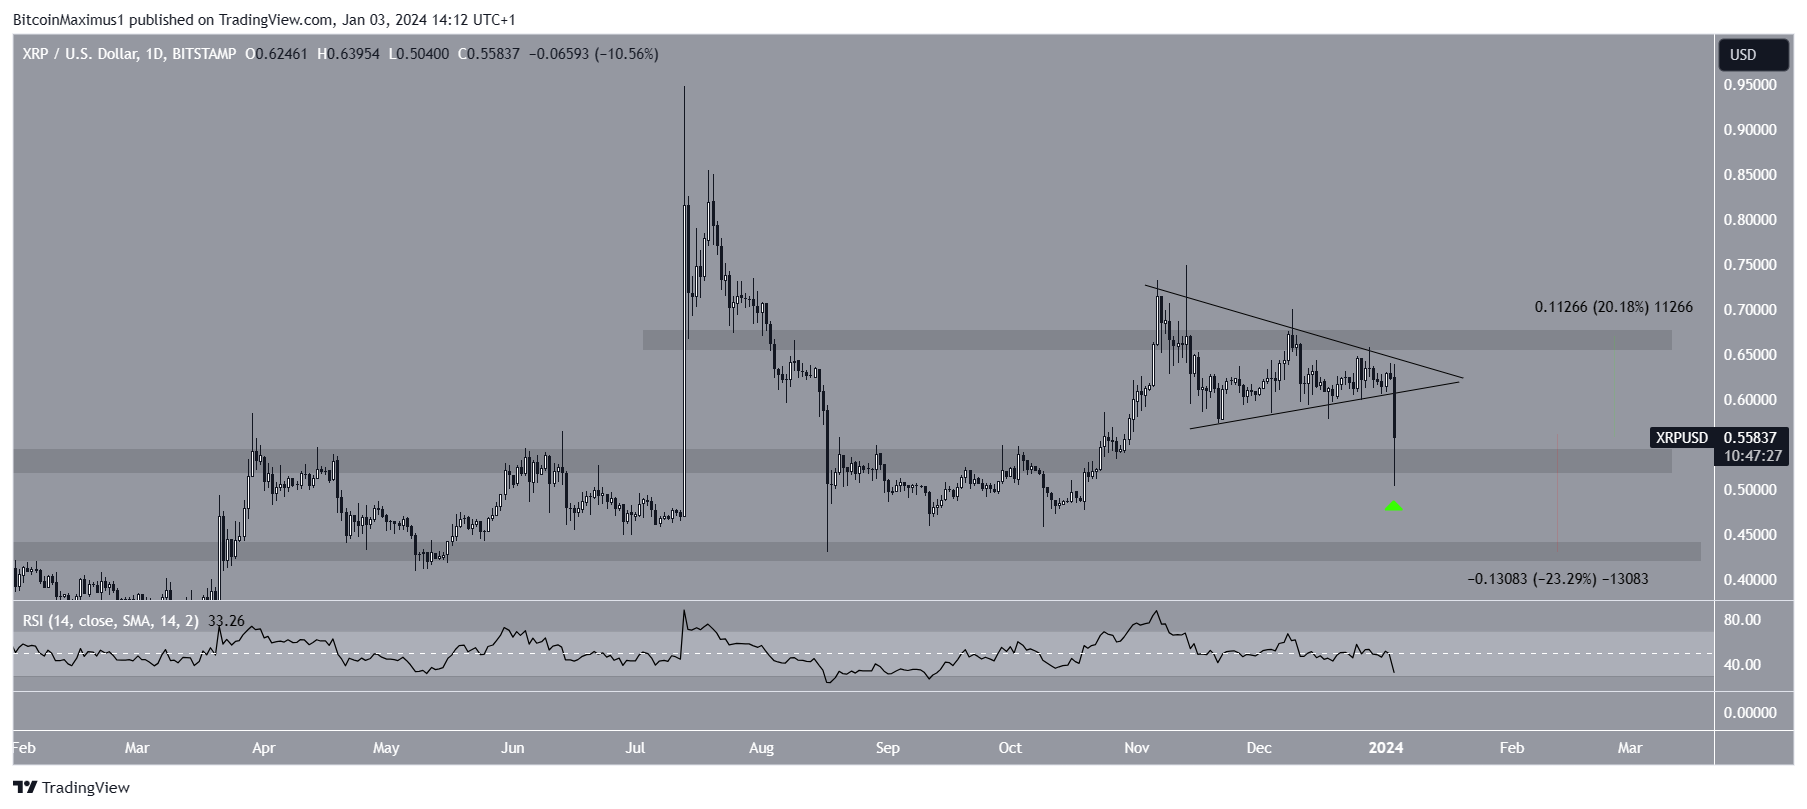
A breakdown below $0.54 can cause a 25% XRP price decrease to the next closest support at $0.42. On the other hand, a successful bounce can lead to a 20% increase and a retest of the $0.67 resistance.
For BeInCrypto’s latest crypto market analysis, click here.
Disclaimer
In line with the Trust Project guidelines, this price analysis article is for informational purposes only and should not be considered financial or investment advice. BeInCrypto is committed to accurate, unbiased reporting, but market conditions are subject to change without notice. Always conduct your own research and consult with a professional before making any financial decisions. Please note that our Terms and Conditions, Privacy Policy, and Disclaimers have been updated.

Be the first to comment